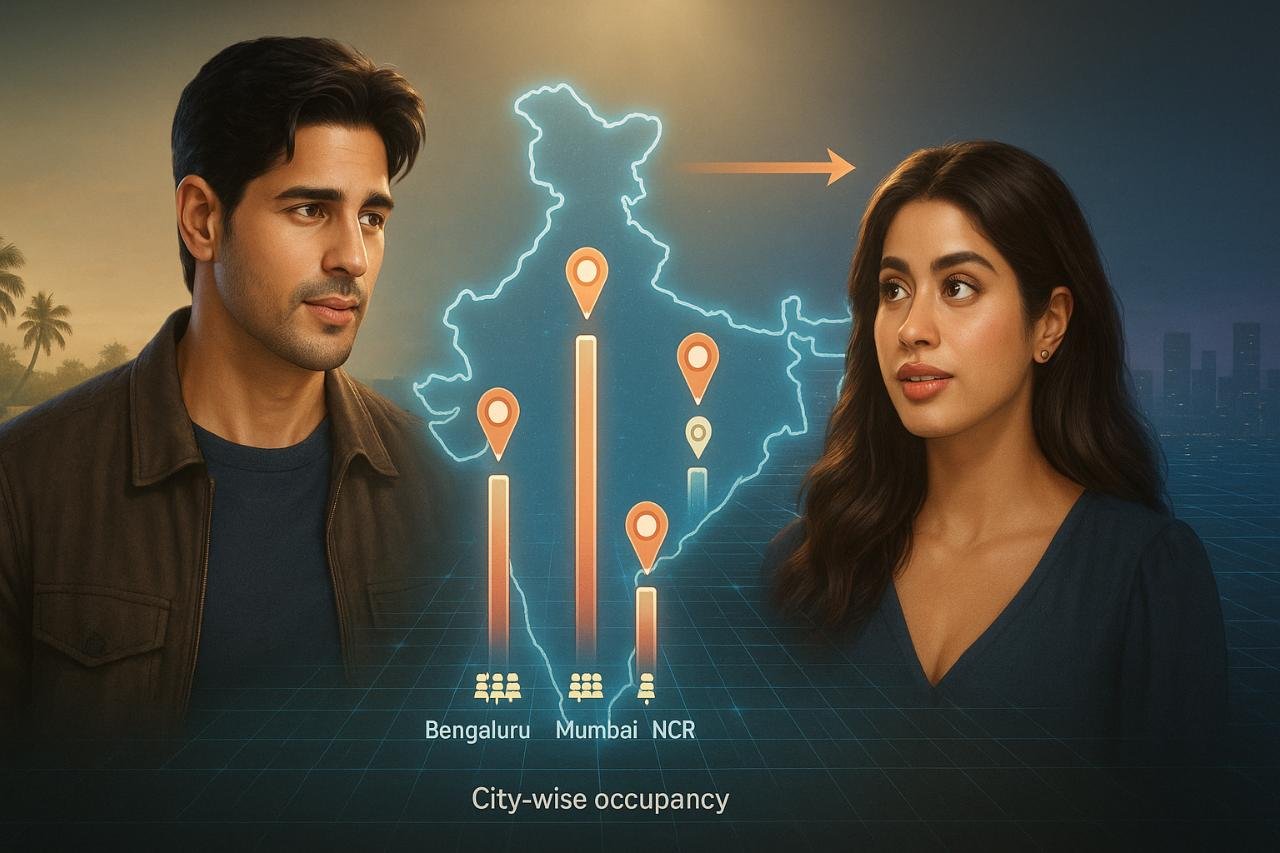

Param Sundari की opening में सबसे दिलचस्प कहानी box office numbers नहीं, बल्कि city-wise occupancy रही। South की metros—Bengaluru और Chennai—ने North-West के मुकाबले कहीं बेहतर footfalls दिखाए। ये फर्क weekend की growth और word-of-mouth trajectory को कैसे मोड़ेगा—यही हमारा फोकस है।
Byline: By Priya Mehra, Bollywood News Specialist – Fact-checked and reviewed by our editorial team – Updated 31 अगस्त 2025, सुबह 9:00 IST
Highlights / खास बातें
- Day 1 पर Bengaluru ~24.50% और Chennai ~24.75%; Ahmedabad ~9.25%, Pune ~11.25% से काफी आगे। (Sacnilk)
- Day 2 (Sat, early estimates) में South की लय तेज: Bengaluru ~40.75%, Chennai ~36.50%; Ahmedabad ~14%, Pune ~16.25%. (Sacnilk)
- कुल मिलाकर opening day India net ~₹7.25 करोड़; Day 2 estimates ~₹9 करोड़—weekend growth दिख रही है। (Sacnilk)
- Trade coverage भी इसी regional split की पुष्टि करता है; Delhi-NCR में शो ज्यादा, occupancy lower रही। (mint)
पृष्ठभूमि और संदर्भ (Background & Context)
Param Sundari (Sid–Janhvi) ने शुक्रवार को 12.92% overall Hindi occupancy दर्ज की और India net ~₹7.25 करोड़ से शुरुआत की। शनिवार को occupancy और collections—दोनों में uptick दिखा, जो कि word-of-mouth के लिए अच्छा संकेत है। (Sacnilk)
“Param Sundari had an overall 12.92% Hindi Occupancy on Friday, August 29, 2025.” (Sacnilk)
कई mainstream reports ने भी यही बताया कि फिल्म की मजबूती South metros में दिख रही है। एक coverage के मुताबिक, “Bengaluru led with ~24.5% occupancy, Chennai ~24.75%, Hyderabad ~21.75%.” (mint)
मुख्य विश्लेषण (The Core Analysis)
South ने lead क्यों लिया?
- Culture connect & setting: फिल्म का बड़ा हिस्सा Kerala backdrop से जुड़ा है; visuals और milieu South audience से organic connect बनाते हैं—regional pull बढ़ता है।
- Show mix vs demand: Day 2 के data में Bengaluru 40.75% और Chennai 36.50% जैसी high evening-night fills दिखती हैं—यानी urban weekend crowd late shows में consolidate हो रहा है। (Sacnilk)
- North-West softness: Delhi-NCR में shows बहुत ज्यादा (1233) थे, पर occupancy ~14.5–18.5% के बीच रही—supply ज़्यादा, per-show demand comparatively कम। (mint, Sacnilk)
City-wise occupancy: Day 1 बनाम Day 2
नीचे चार प्रमुख शहरों का Sacnilk live tracker आधारित snapshot (Overall %):
| शहर | Day 1 (शुक्रवार) | Day 2 (शनिवार, early est.) |
|---|---|---|
| Bengaluru | 24.50% | 40.75% |
| Chennai | 24.75% | 36.50% |
| Ahmedabad | 9.25% | 14.00% |
| Pune | 11.25% | 16.25% |
Source: Sacnilk city-wise occupancy tables (Day 1, Day 2). (Sacnilk)
Weekend growth का क्या संकेत?
- Trajectory: Day 1 → Day 2 में South metros की double-digit jump बताती है कि film की acceptance pockets साफ़ हैं।
- Business math: High-yield cities में average ticket price (ATP) भी ऊंचा रहता है; ऐसे में समान footfalls से भी net better आ सकता है—पर ये अलग-अलग chains/ATP mix पर निर्भर है।
- Risk: अगर North-West में family walk-ins slow रहे, तो weekend peak के बाद weekday drop sharper हो सकता है; Monday hold critical होगा।
इंडस्ट्री और एक्सपर्ट्स की राय (Industry & Expert Opinions)
“Delhi-NCR had the highest number of shows… but only ~14.50% occupancy. Bengaluru, Chennai, and Hyderabad witnessed the highest occupancy.” (mint)
क्रिटिक रडार पर फिल्म को mixed reviews मिले—कुछ ने chemistry को plus बताया, कुछ ने writing/tonality की कमी उठाई—जिसका असर region-wise word-of-mouth पर पड़ सकता है। (The Times of India, The Indian Express)
इसका क्या मतलब है? (The Bigger Picture)
अगर South-led occupancy weekend भर टिकती है और North-West में late pickups आते हैं, तो Param Sundari का first weekend healthy दिख सकता है। वरना बिज़नेस pocketed रह जाएगा—यानी collections कुछ चुनिंदा cities पर disproportionately निर्भर।
FAQ Section
Q1. क्या सच में Bengaluru/Chennai ने Day 1 पर Ahmedabad/Pune को पछाड़ा?
हाँ—Bengaluru ~24.50%, Chennai ~24.75% बनाम Ahmedabad ~9.25%, Pune ~11.25%। ये Sacnilk के city-wise tracker से verified है। (Sacnilk)
Q2. Day 2 पर trend कैसा रहा?
South metros में तेज़ उछाल—Bengaluru ~40.75%, Chennai ~36.50%; Ahmedabad ~14%, Pune ~16.25% के आसपास। (Sacnilk)
Q3. कुल collections क्या कहते हैं—opening weak थी या decent?
Opening day India net ~₹7.25 करोड़; Day 2 early estimates ~₹9 करोड़—यानी weekend growth दिख रही है। (Sacnilk)
Q4. Delhi-NCR में इतने shows के बाद occupancy कम क्यों?
Scheduling mix और audience preference की वजह से per-show fills कम रहे; coverage के मुताबिक 1233 shows के बावजूद occupancy ~14.5%—demand thinly spread दिखी। (mint)
Source Links
- Sacnilk – Day 1 city-wise occupancy & collection. (Sacnilk)
- Sacnilk – Day 2 city-wise occupancy (early est.). (Sacnilk)
- LiveMint – South metros led occupancy; NCR shows vs occupancy. (mint)
- Hindustan Times – Day 1/2 box office coverage. (Hindustan Times)
- Times of India – Review & live occupancy updates. (The Times of India)
- Indian Express – Early estimates/Review. (The Indian Express)